When you want to view a comprehensive summary and statistical data of large datasets, you can use the Dashboard Report in Ragic. For example, you can analyze order amounts, customer spending, or daily revenue.
The Dashboard Report allows you to view the total, average values, and visual charts of multiple fields from your sheet.
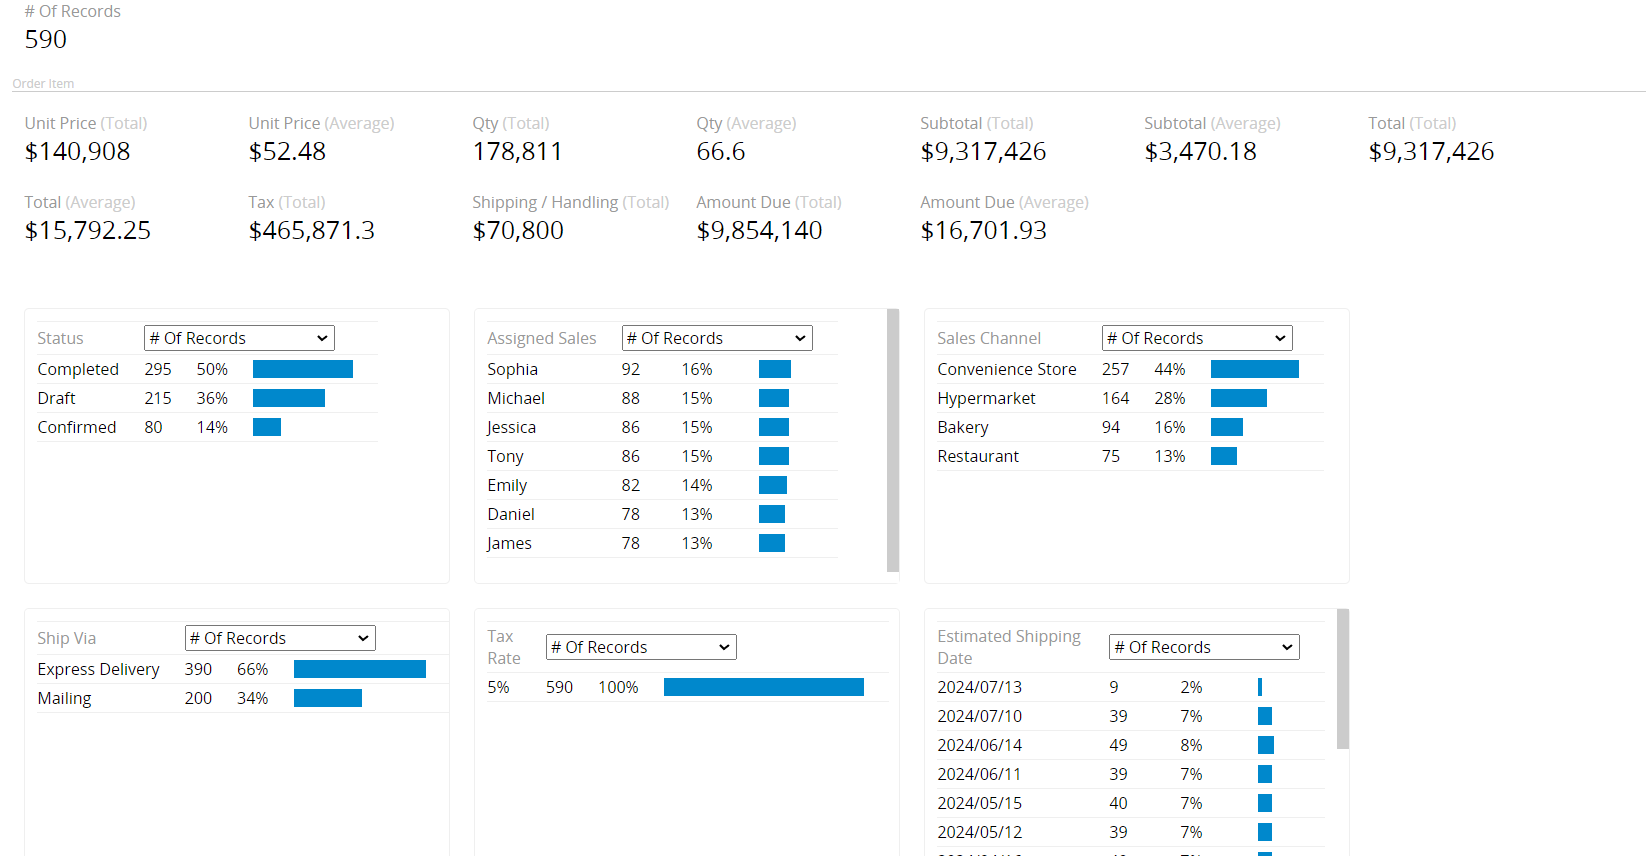
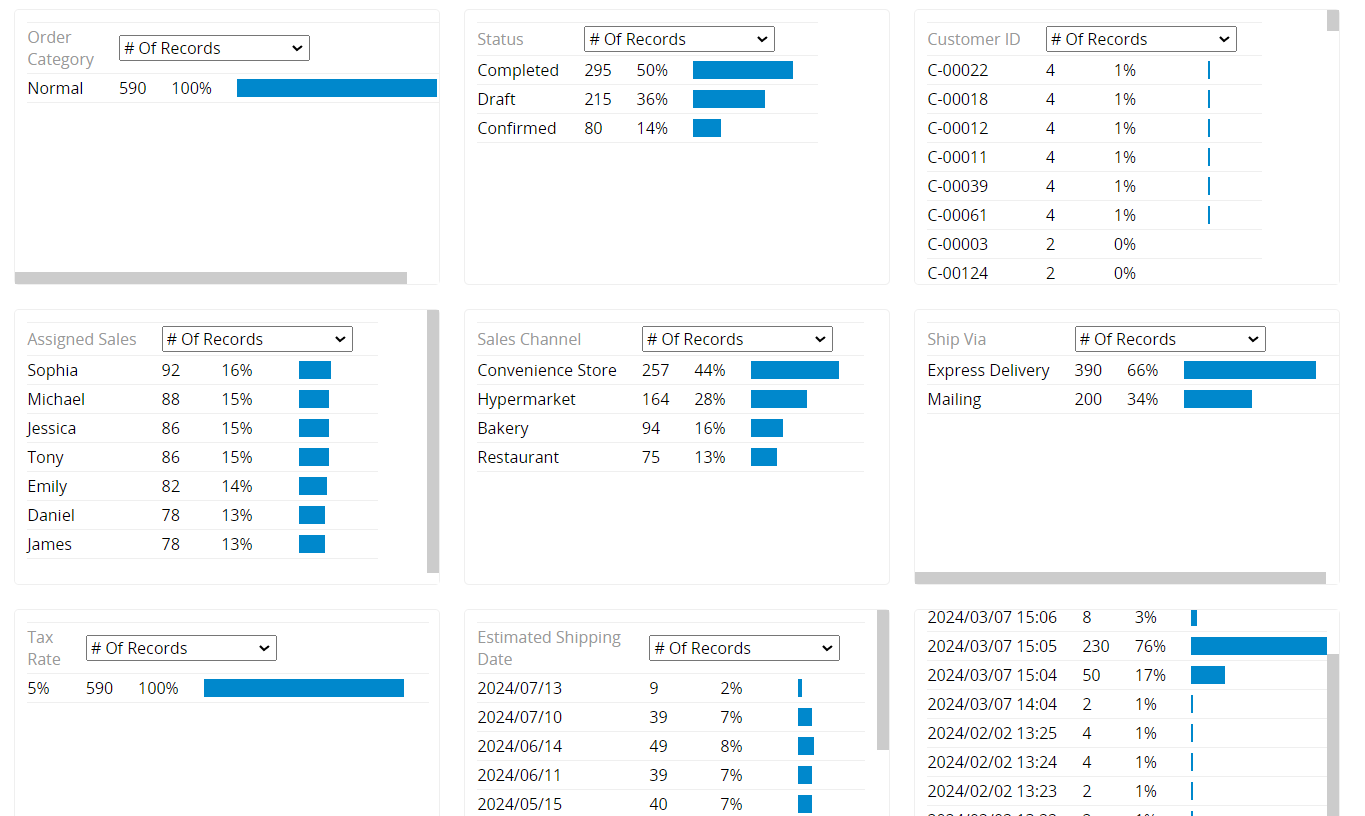
After creating the Dashboard Report, the following page will appear.
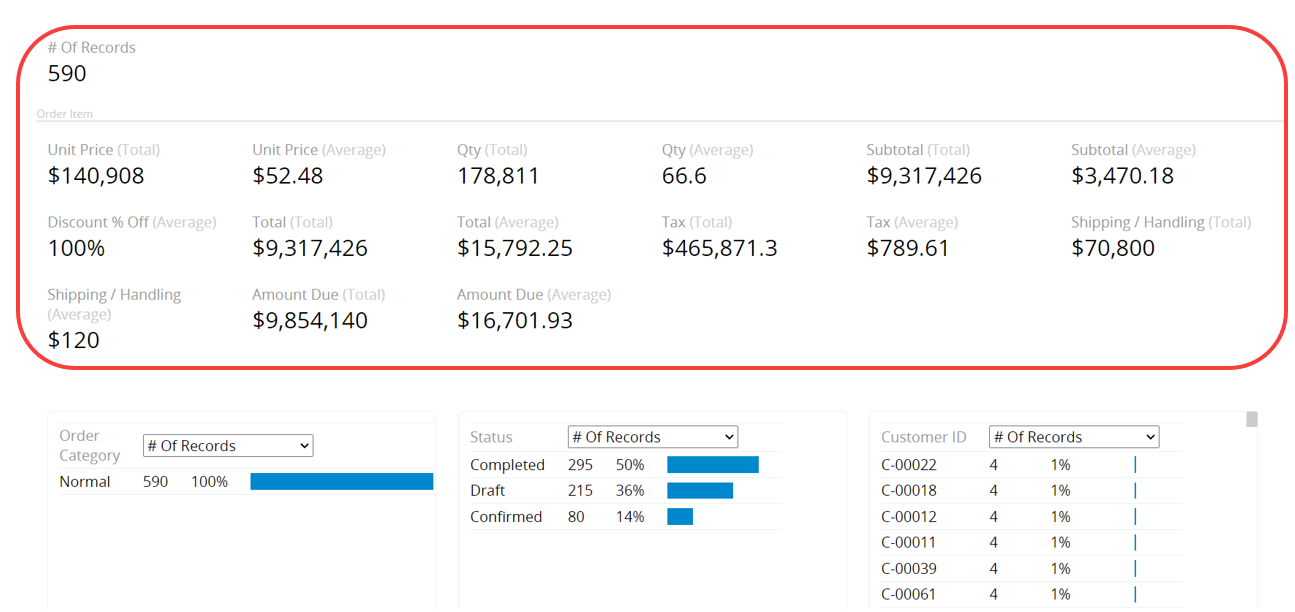
At the top of the report, the statistics for each field in the sheet will be displayed, including the "# Of Records", "Quantity", and "Amount".
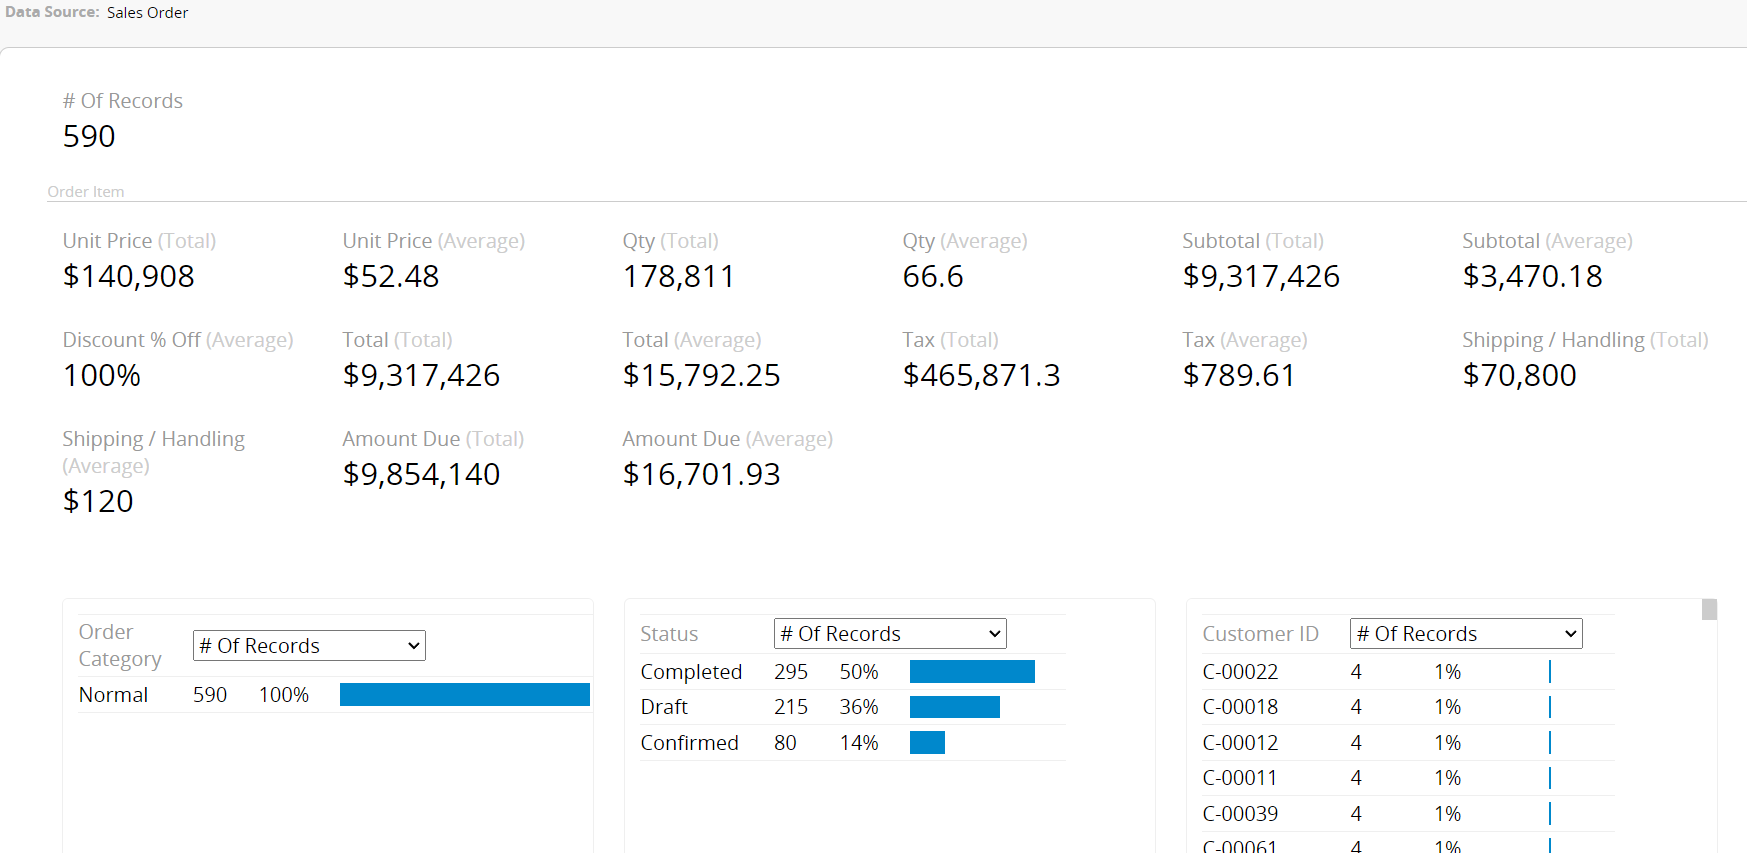
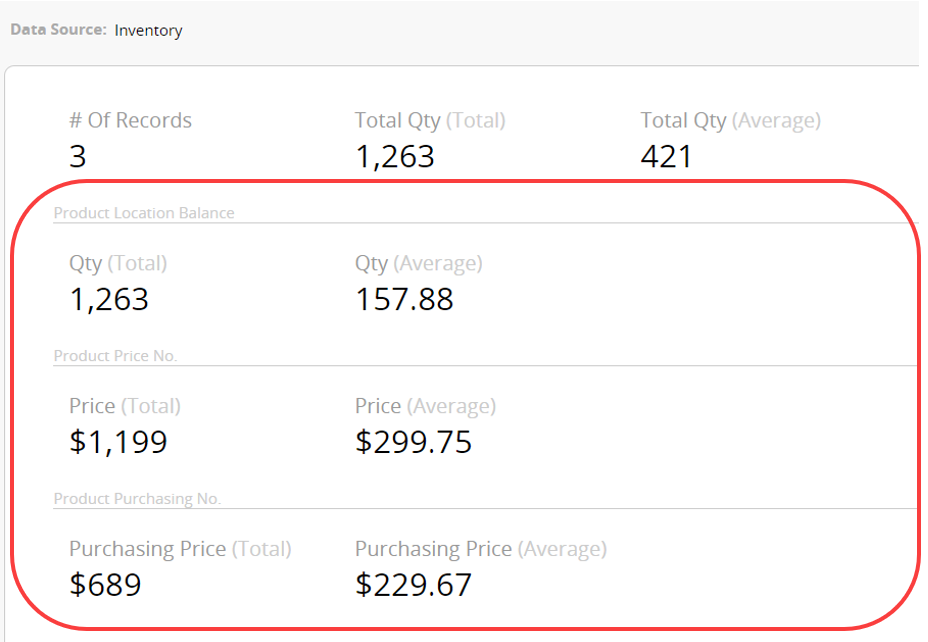
Statistics for each field will be displayed in the order they appear on the sheet, from left to right and top to bottom. Subtable fields will also be individually summarized and presented sequentially, including hidden Subtables, as shown below.
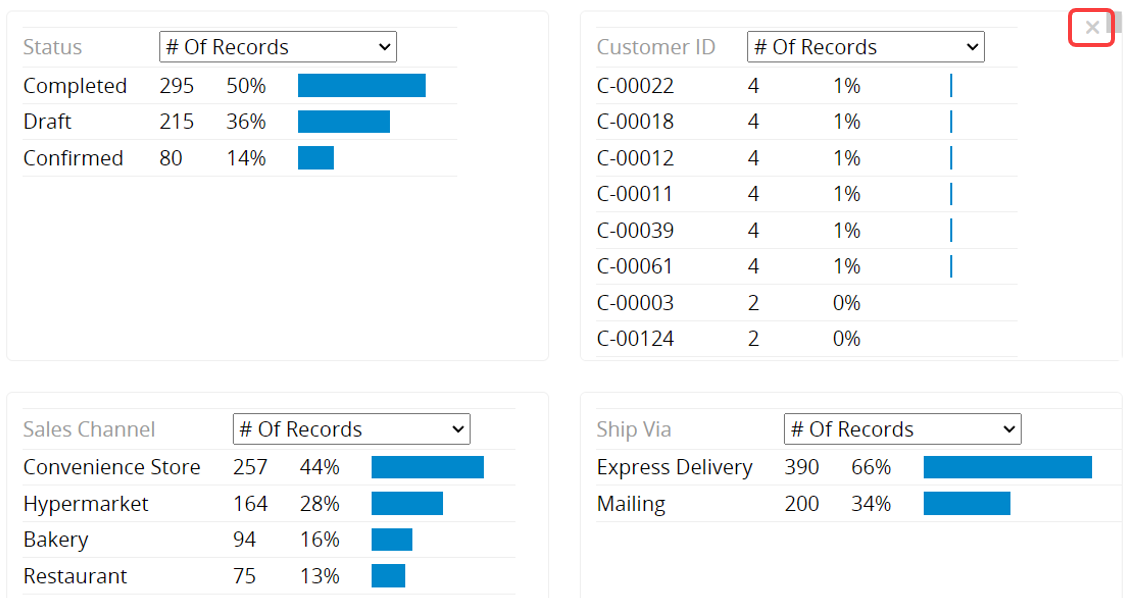
In the lower part of the report, detailed data analysis for each field item is displayed.
In the Dashboard Report, only Date fields and Selection/Linked fields (e.g., Selection, Select User, Select From Other Sheet, etc.) can be analyzed. Other Field Types cannot be analyzed. Hidden fields can be included if they fall into these categories.
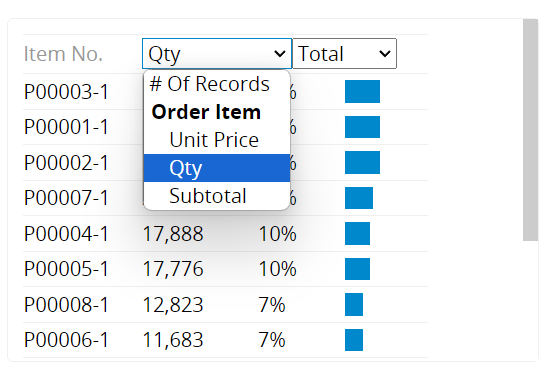
You can use the dropdown menu next to each field name to select the data for analysis. Options include # of Records, and Numeric, Percentage, and Money Field Types. Once you select an analysis option for one field, all fields will display the same option; you cannot choose different analysis options for individual fields.
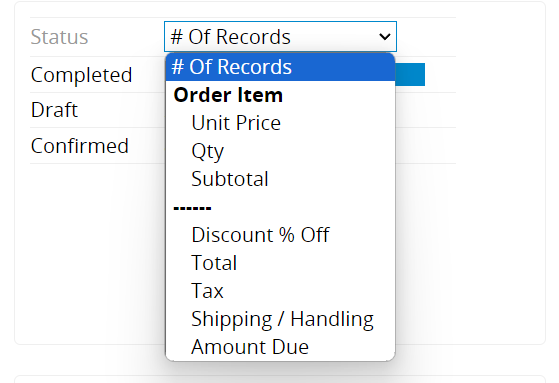
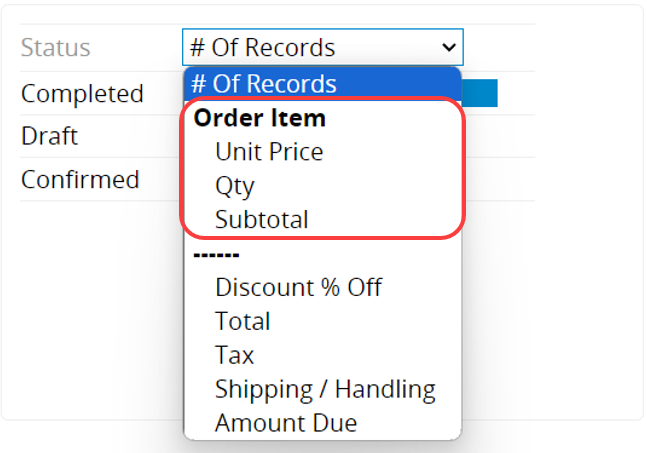
In the dropdown menu, bold text represents the titles of Subtables, with the items below corresponding to the fields within those Subtables. After selecting a Subtable item, you can only analyze fields corresponding to that Subtable.
For example, if you choose to analyze the "Qty" field from a Subtable, other field items will disappear, and only the data from that Subtable field will be displayed.
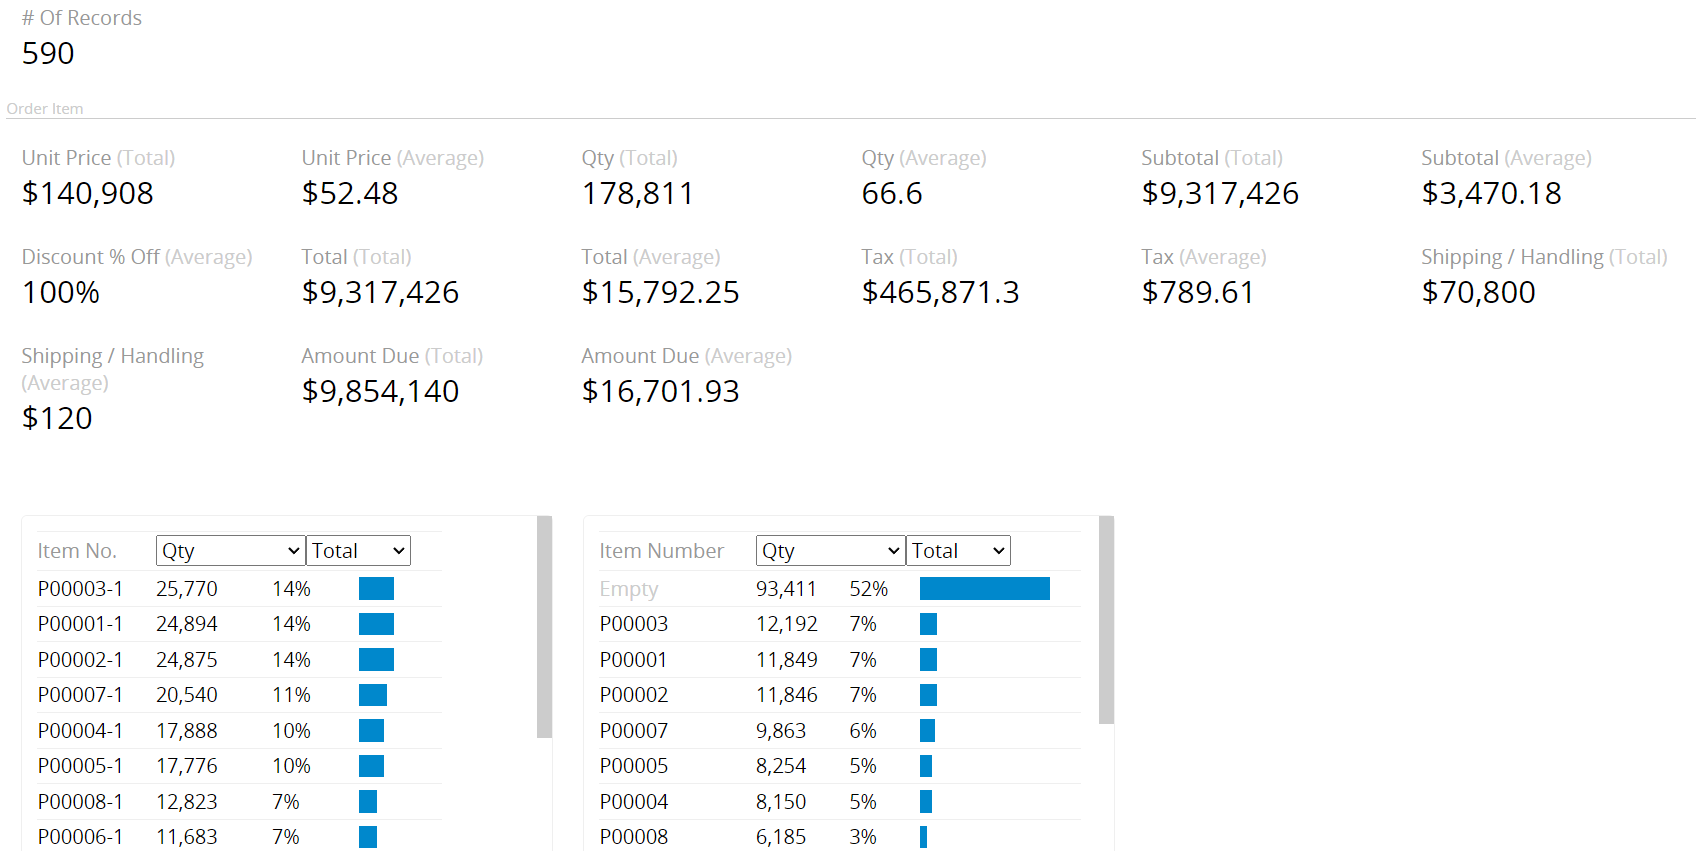
Additionally, after selecting a Subtable for analysis, only "# of Records" or items from that Subtable will be available. To return to the initial state where all fields can be selected, choose "# of Records" first, and then all options will reappear.
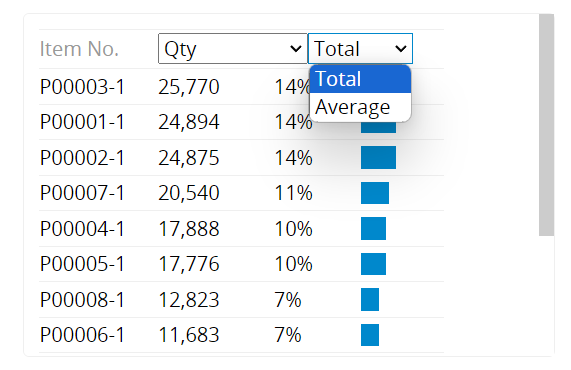
In addition to "# of Records", when analyzing other items, you can choose to display either the Total or Average of the data.
To remove a field from analysis, move your mouse to the upper right corner of the field box to reveal the ![]() icon. Click it to remove the field.
icon. Click it to remove the field.
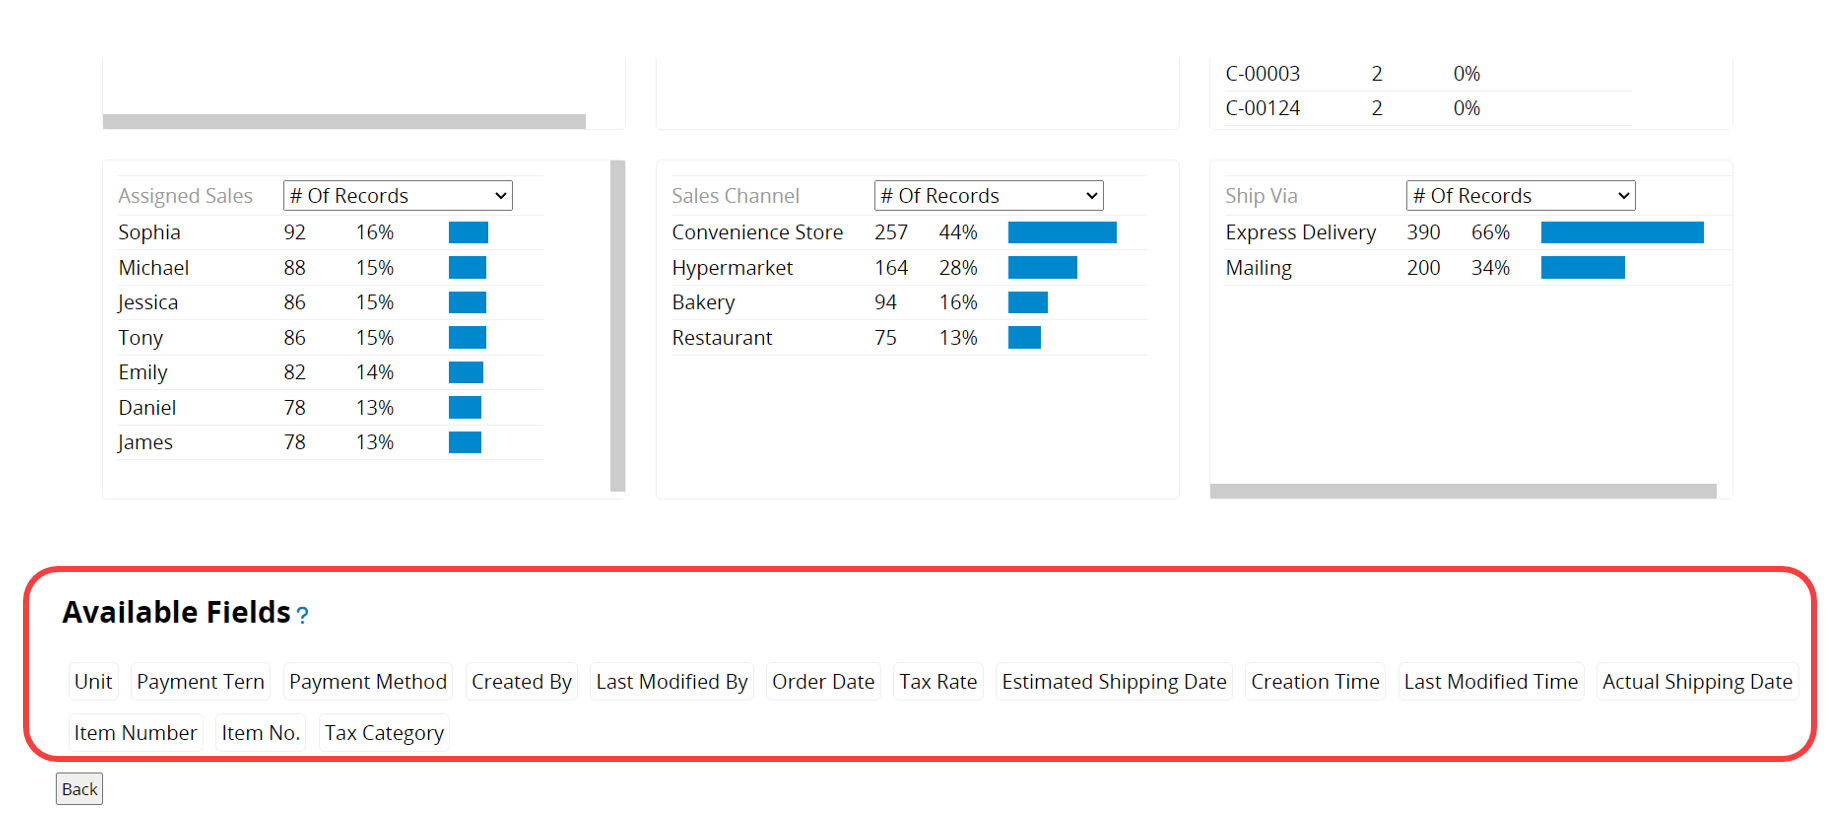
To restore or reselect the fields for analysis, go to the bottom of the report where you'll find Available Fields. Click on the name of the field you want to analyze to add it back to the Dashboard Report.
If the sheet does not contain any fields that can be analyzed, such as "Selection", "Linked", "Date", "Money", or "Numeric" fields, the report will only display the # of Records.
If you frequently use this type of report, you can save it for easy access later. Additionally, you can export the report as a PDF file or print it.
You can apply filters to generate the desired report.
You can embed the report into your website or share a link with others.
In the Report Settings, you can adjust the report’s style settings, including font, font size, borders, etc., and the report’s Filter and Access Rights.
 Thank you for your valuable feedback!
