You can use the Grouping Report to compare statistical data and differences across various groups. It helps you quickly review and summarize data for each group. For example, you can analyze inventory across warehouses, compare sales in different regions or categories, conduct financial analyses by quarter, etc.
After creating the Grouping Report, the following page will appear.
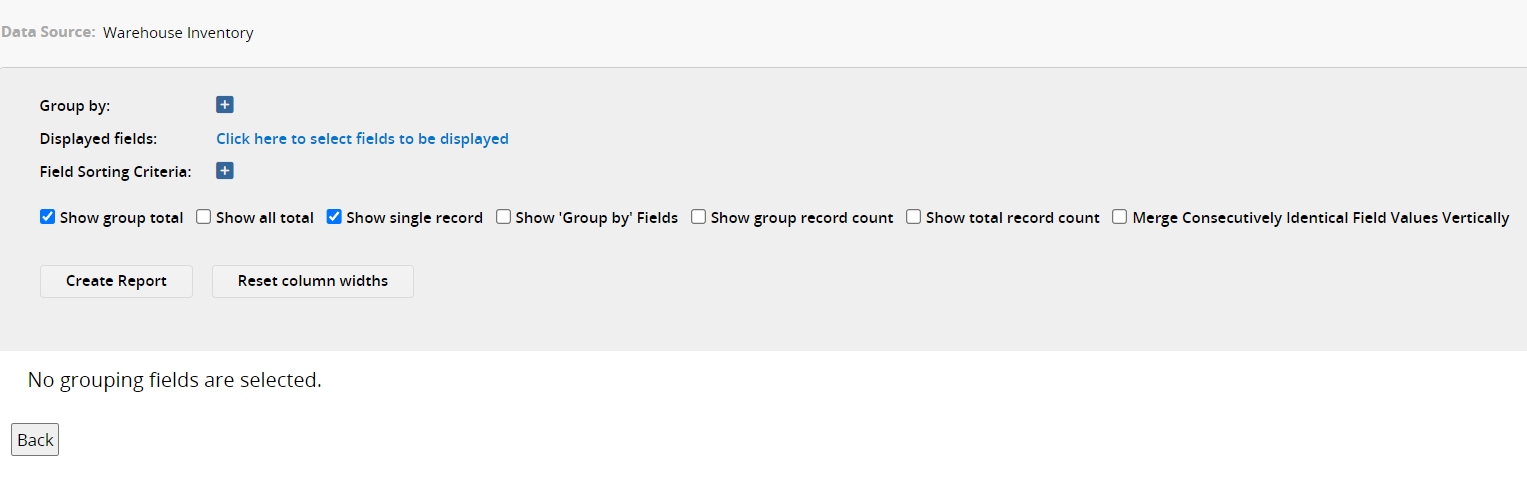
The settings for the Grouping Report are explained below:
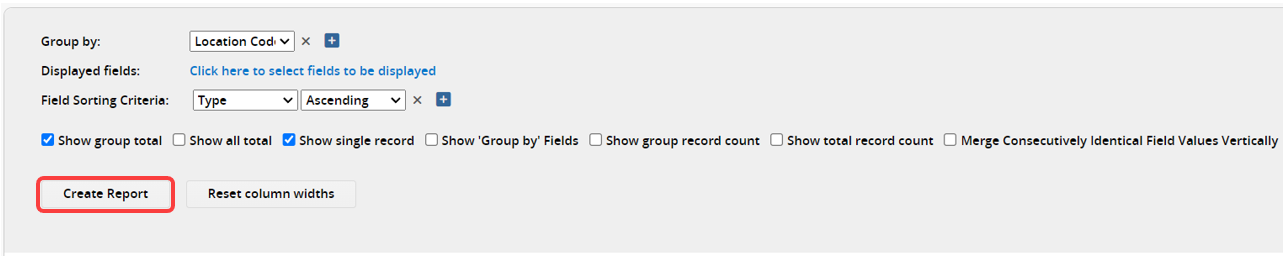
In the top section, select the fields for grouping, as this is required.
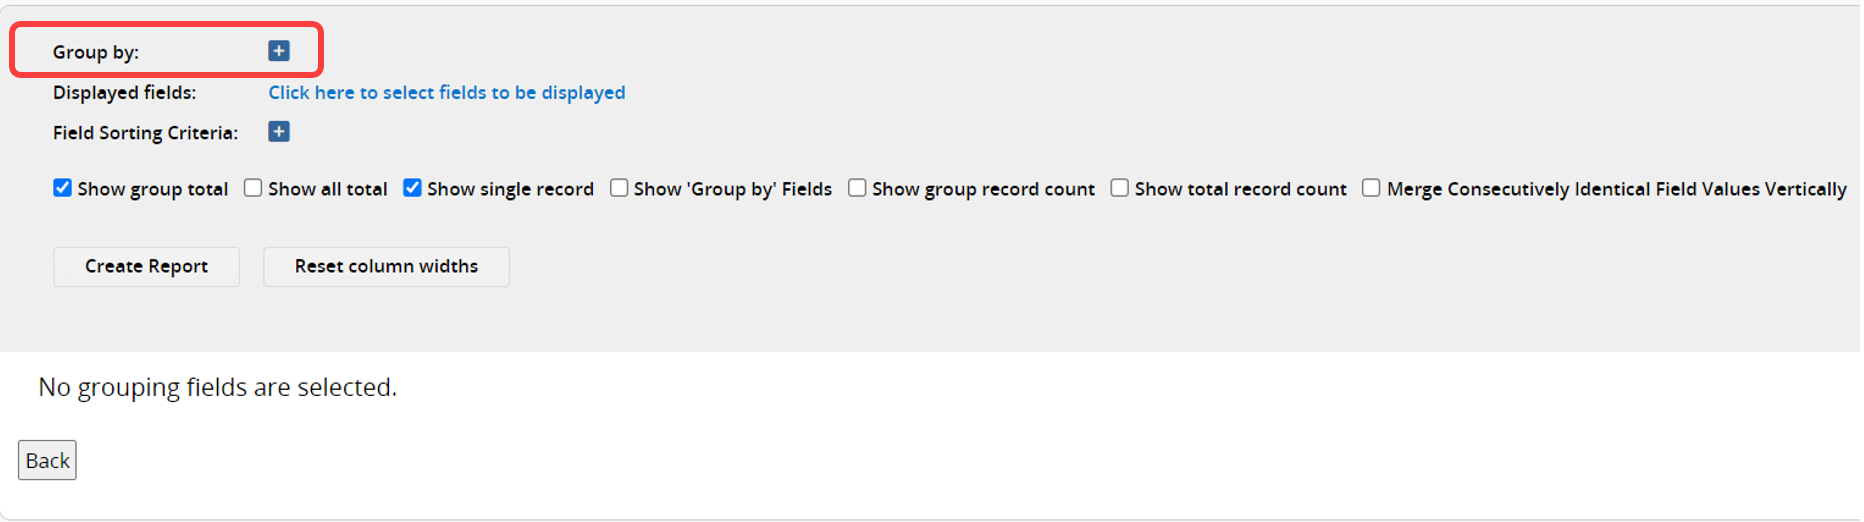
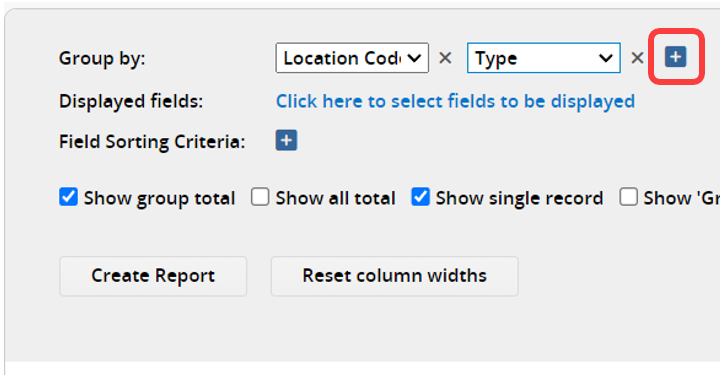
You can choose any field except those in Subtables and add multiple fields by clicking the "+" button.
When the grouping field is multi-select (e.g., a Multiple Select field or a Select User field set to Multiple select), you can check the Split multi-select values option.
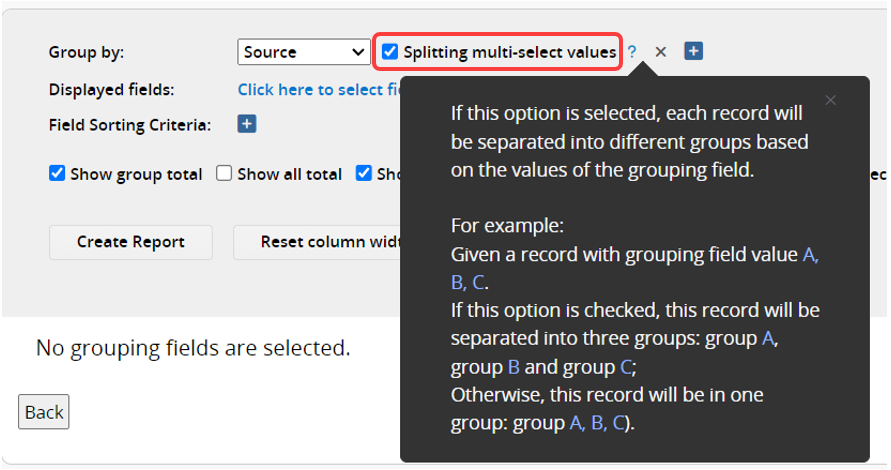
If this setting is checked, the data will be grouped by each option.
For example:
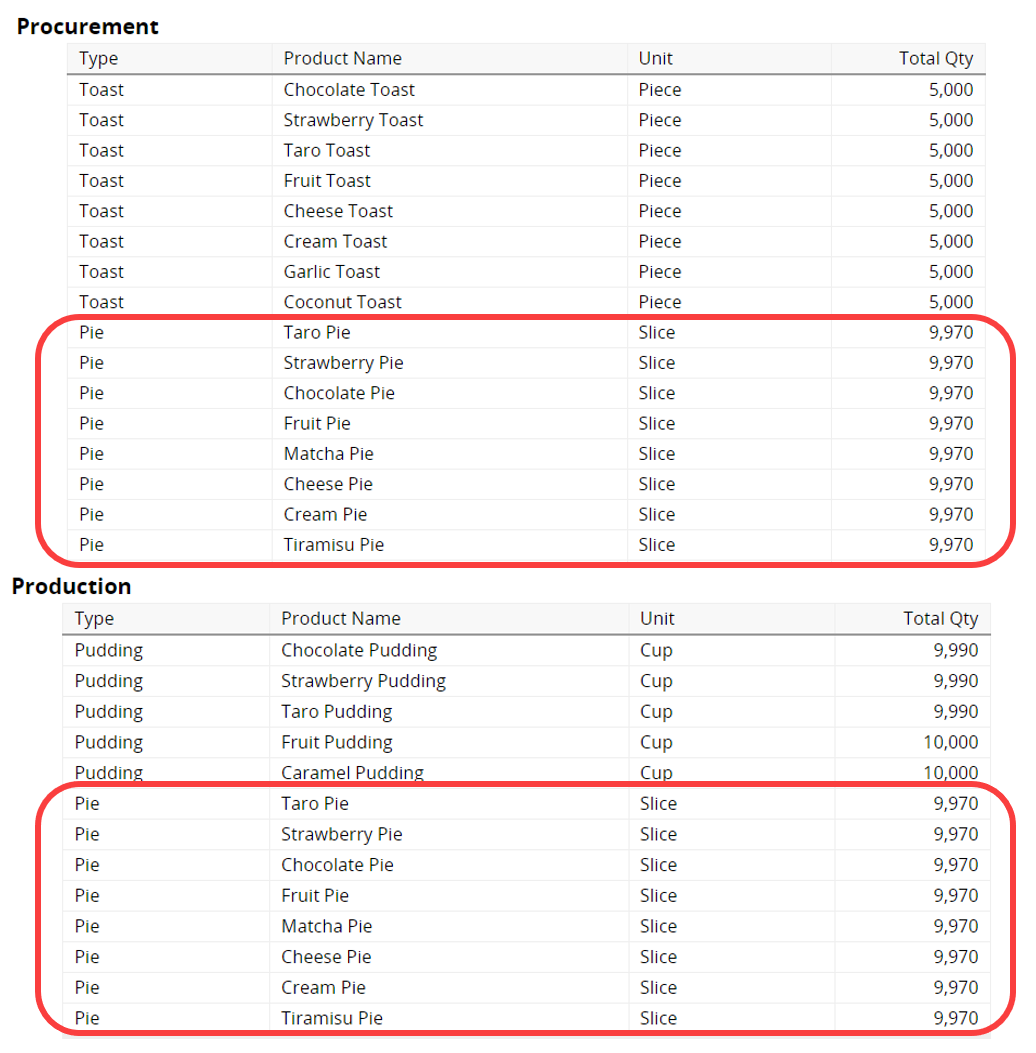
If the source of sales items includes both "Procurement" and "Production", checking this option will place items with both sources into both groups.
In the example below, a "pie" with both "Procurement" and "Production" sources is included in both groups.
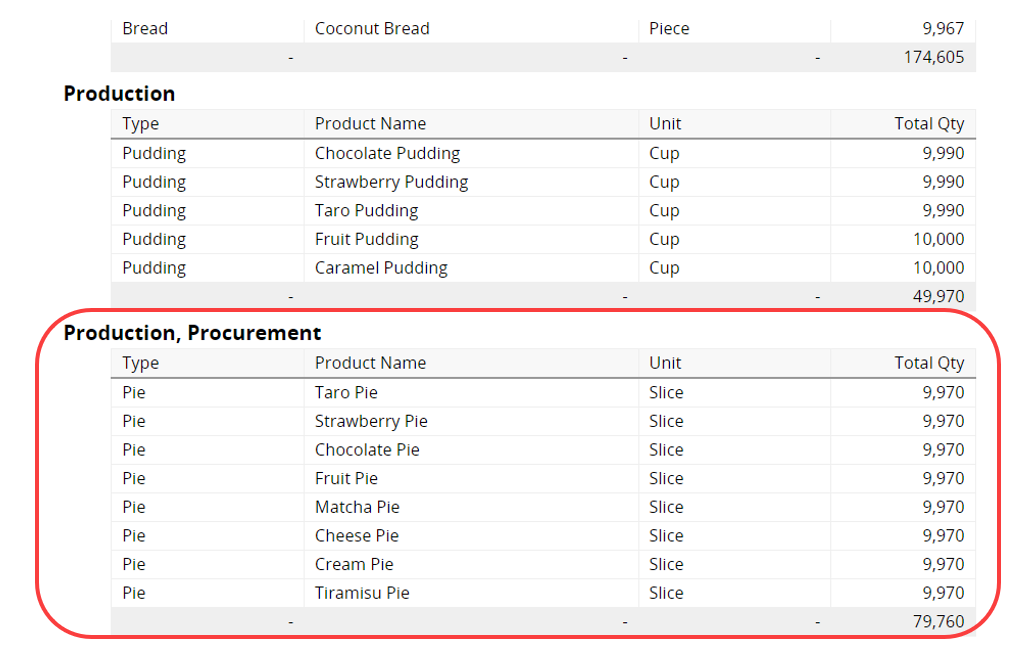
If this option is not checked, the items will be assigned to a single, combined group. In the example below, a separate "Procurement, Production" group is displayed.
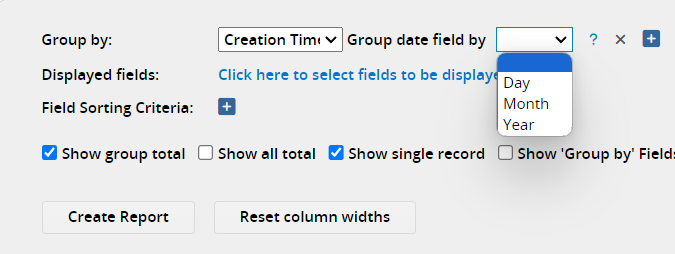
When selecting a Date field, you can choose to categorize the data by "Day", "Month", or "Year".
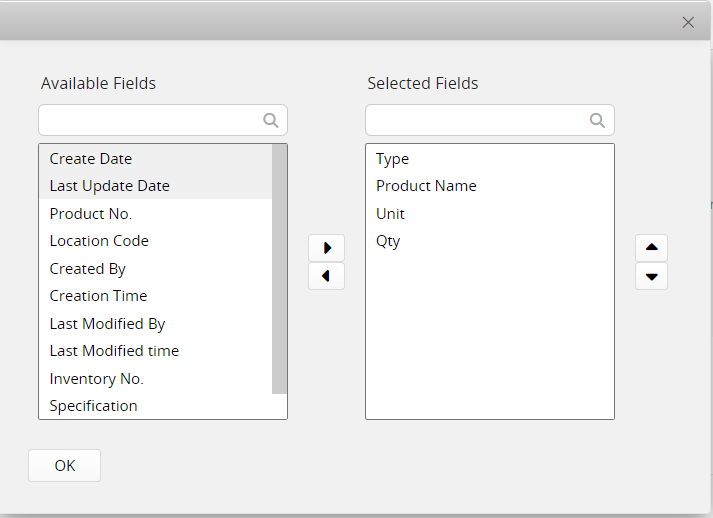
You can choose which fields to display in the report and configure the sorting criteria.
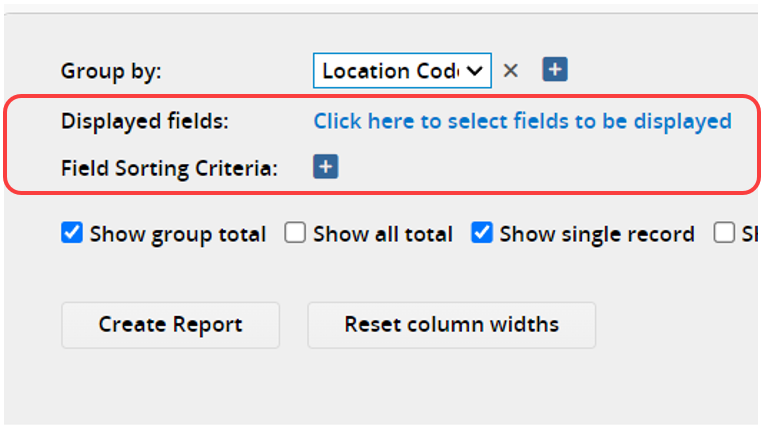
Displayed Fields: You can select any fields except those in Subtables and adjust their display order.
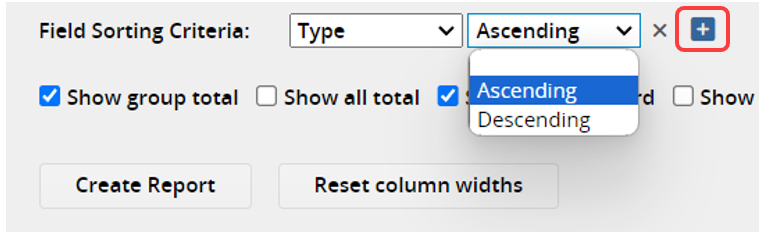
Field Sorting Criteria: You can sort data in "ascending" or "descending" order based on a specific field and add multiple fields by clicking the "+" icon.
You may also configure other display options for data, records, and fields.
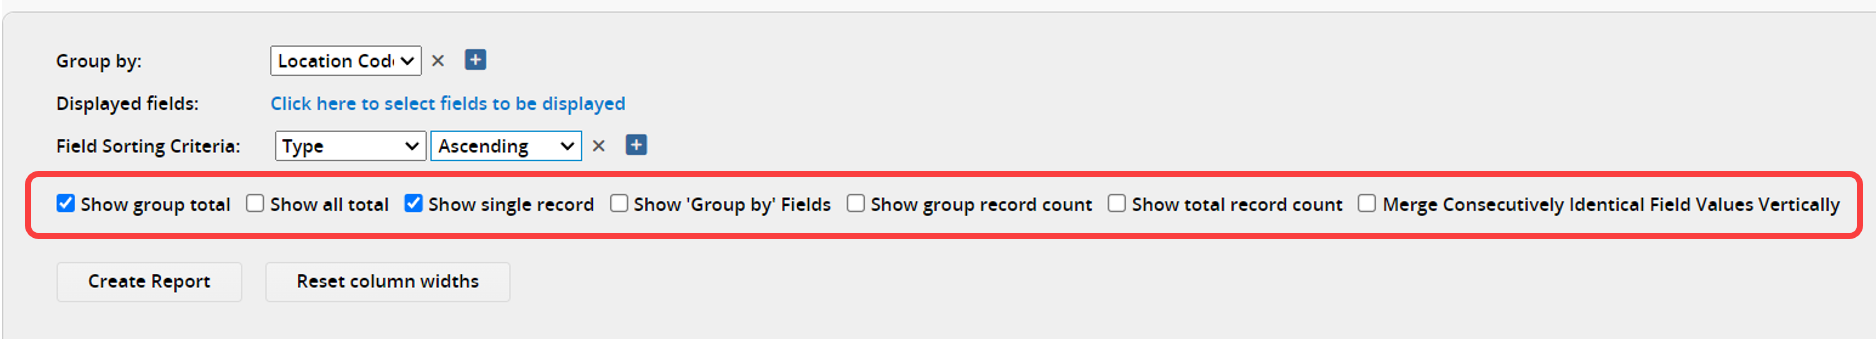
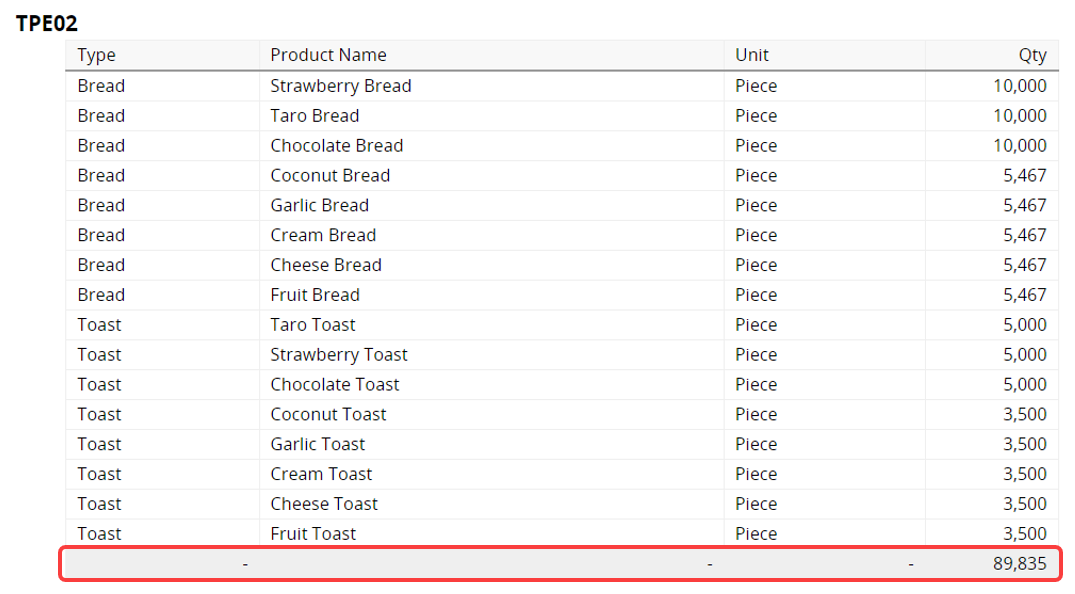
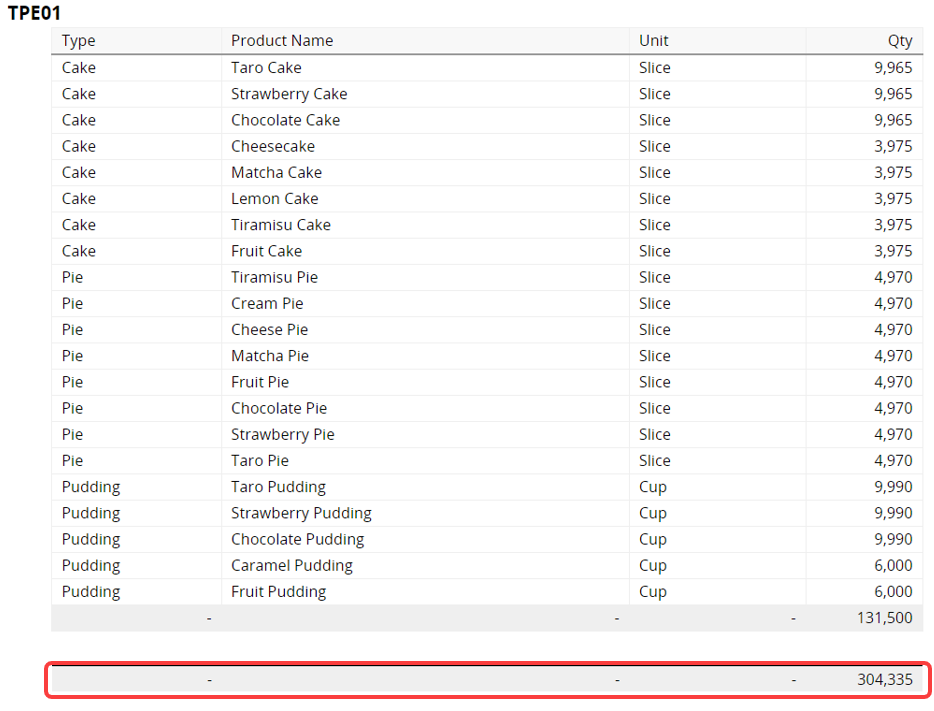
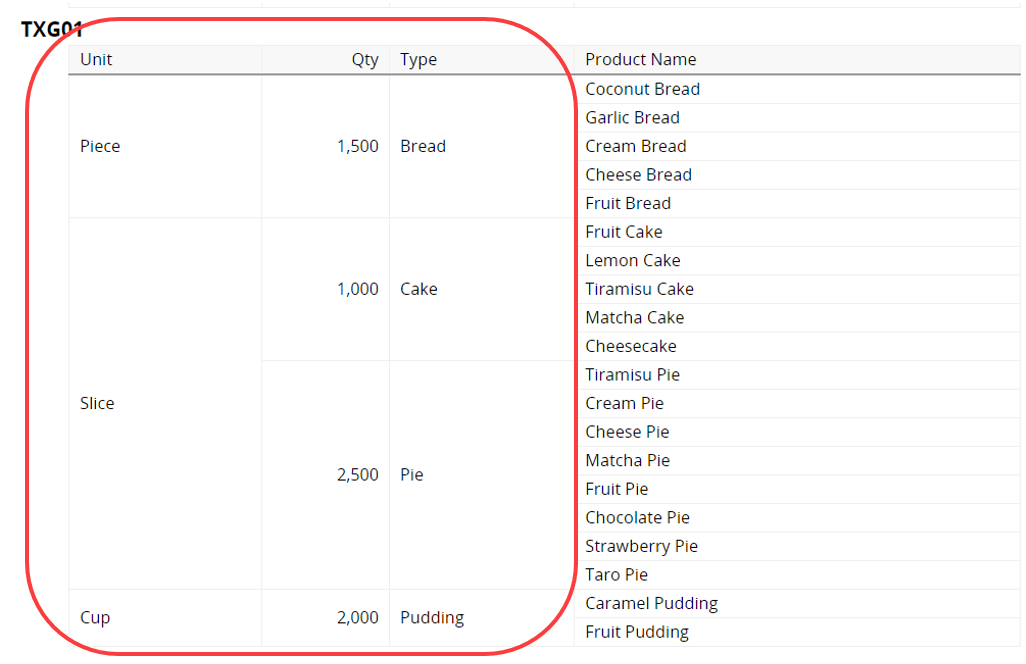
"Show group total": For Numeric and Money fields, this option displays the totals for each group.
"Show all total": Displays the totals for all Numeric and Money fields at the bottom of the report.
"Show single record": If unchecked, only group items will be displayed, and individual records will not be shown.
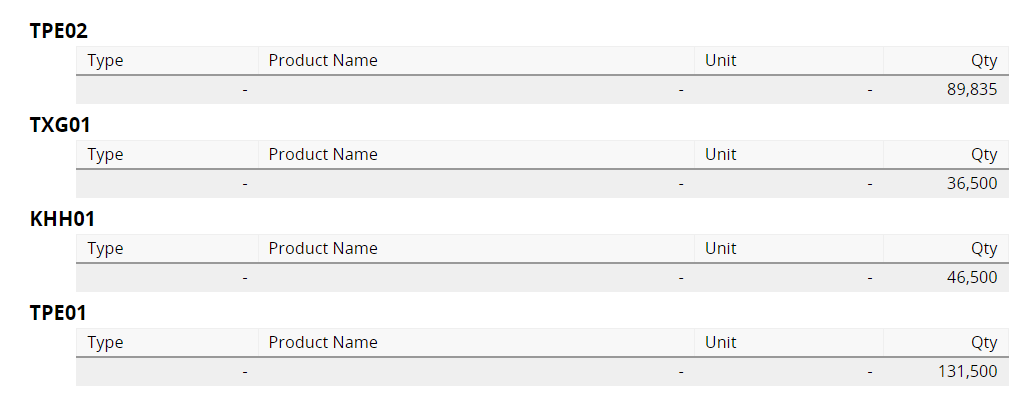
"Show 'Group by' Fields": When selected, the fields used for grouping in the report are displayed.
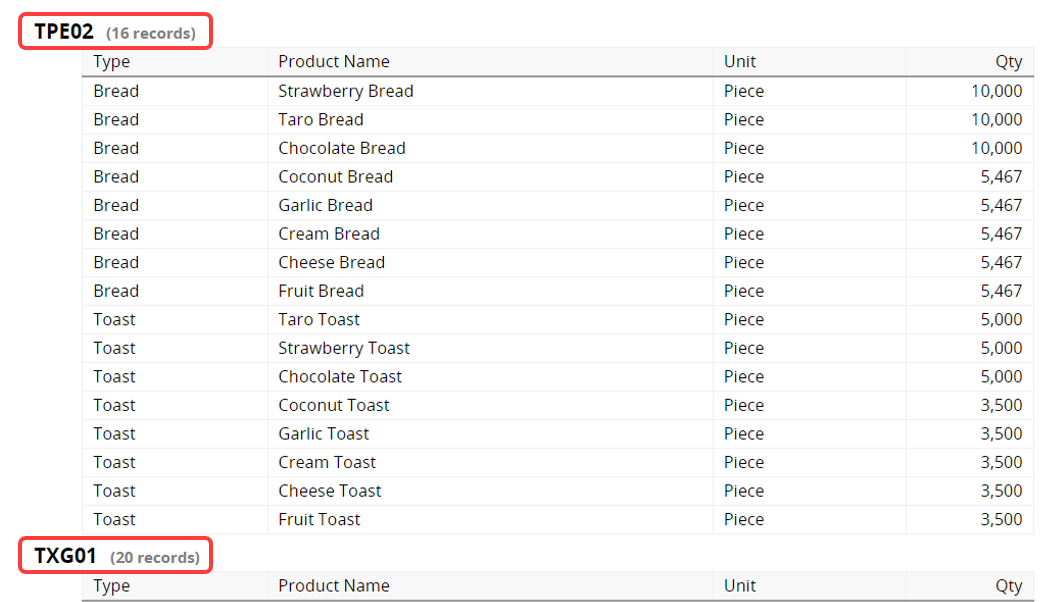
"Show group record count": Displays the number of records for each group next to the group items.
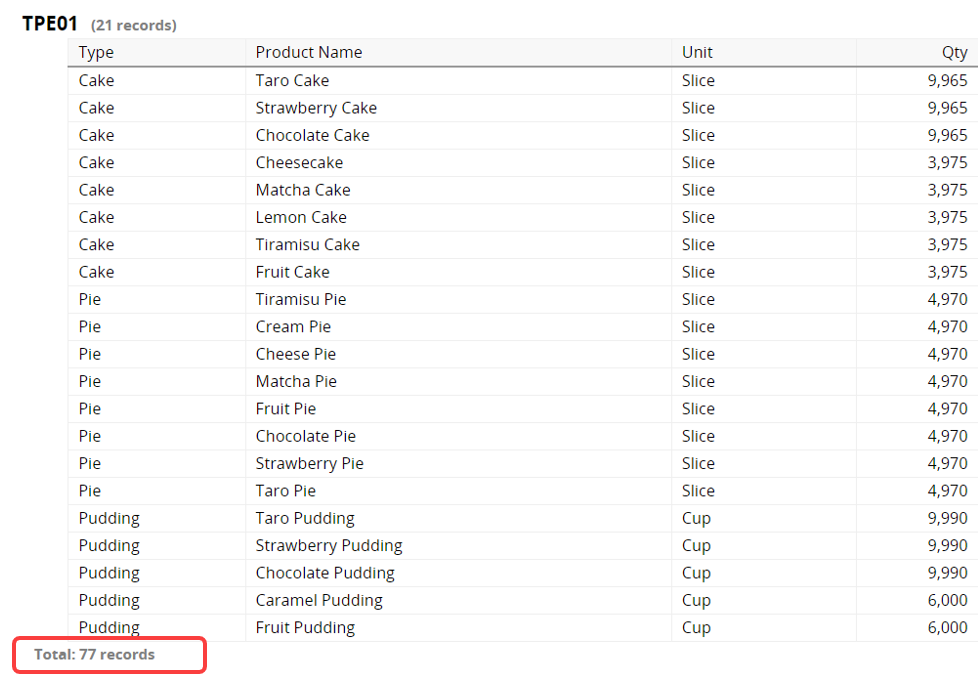
"Show total record count": Displays the total number of records for the sheet at the bottom of the report.
"Merge Consecutively Identical Field Values Vertically": When checked, identical field values will be merged to simplify data viewing. Note that merging will only occur if the preceding Field is merged; therefore, adjust the Displayed Fields order if you want to enable merging.
After each setting adjustment, you need to click Create Report again to update the report.
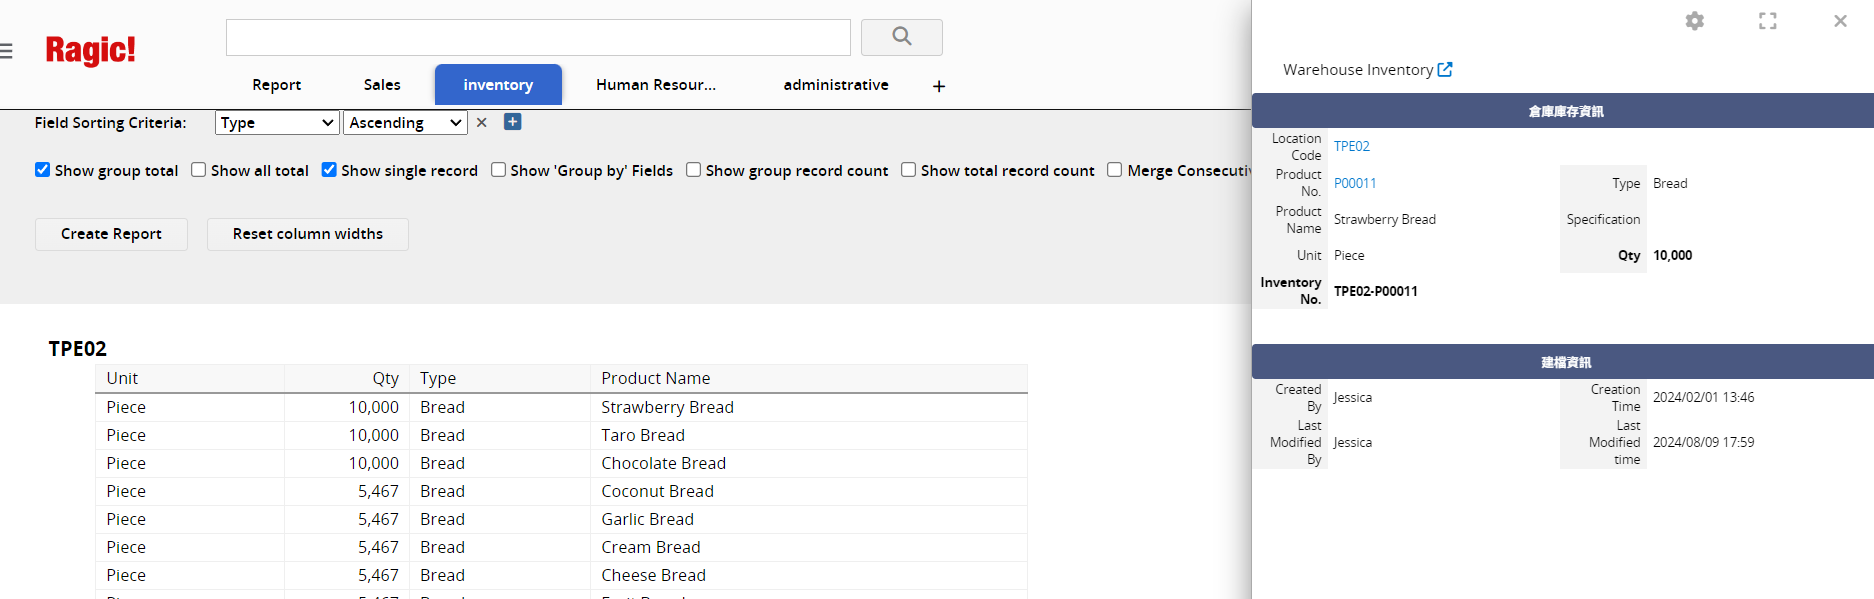
Clicking on an item will display its details on the right side. Additionally, items from merged fields cannot be clicked to view details.
You can adjust the width of the report columns. To reset them, click Reset column widths.
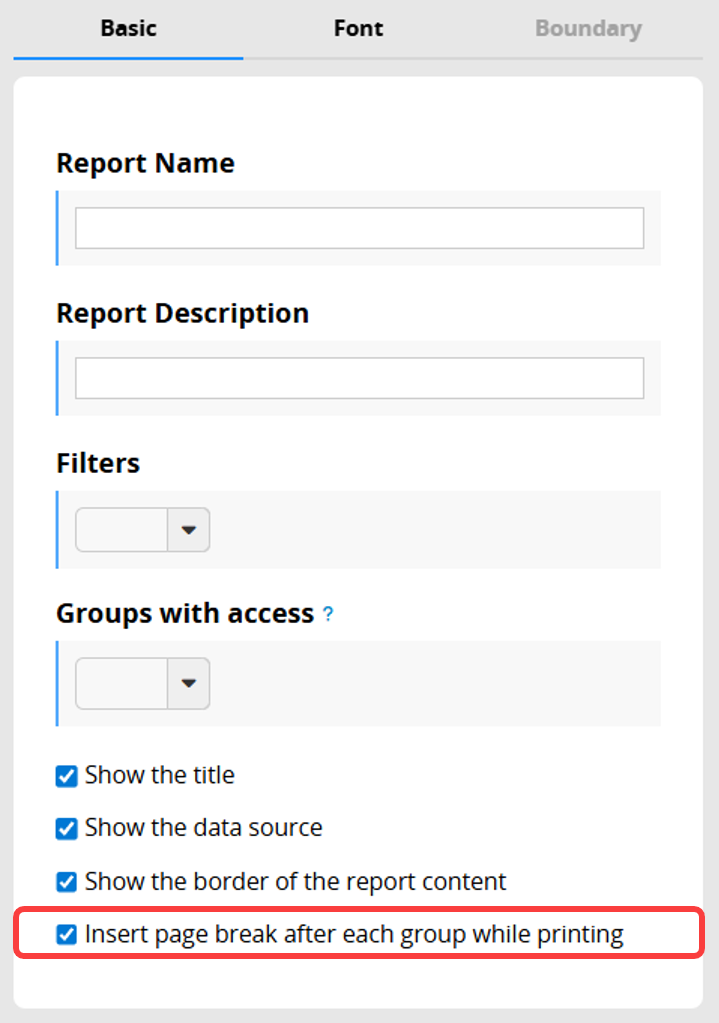
To print each group on a separate page, check the "Insert page break after each group while printing" option in the Report Settings.
If you frequently use this type of report, you can save it for easy access later. Additionally, you can export the report as a PDF file or print it.
You can apply filters to generate the desired report.
You can embed the report into your website or share a link with others.
In the Report Settings, you can adjust the report’s style settings, including font, font size, borders, etc., and the report’s Filter and Access Rights.
 Thank you for your valuable feedback!
